- Have any questions?
- +985-727-7400
Atlas: A World of Data to Improve Rig Performance

Under the Hood of GreenLight
July 7, 2022Remote Solutions
February 28, 2023
By Brad Michael
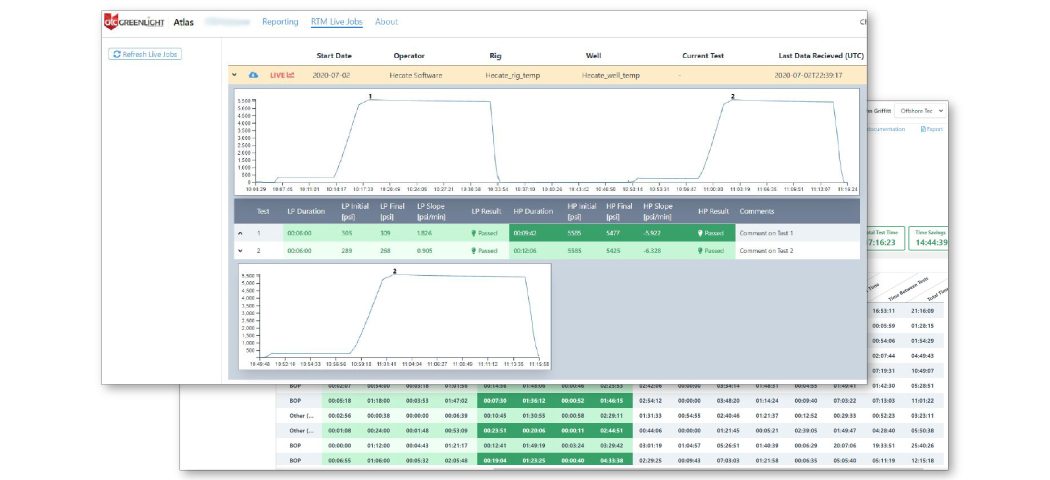
OTC’s Atlas data software system is designed to improve data accessibility for rig operators and offers them the ability to grant access to that data to others, including government officials. Atlas is actually a bit of a Swiss army knife for us at OTC. On our clients’ side, it gives us a place to archive all of their data. We can also give them access to their own data so they can review historical testing results. However, Atlas also has the ability for us to provide remote offshore rig monitoring for current testing. For example, a client might give BSEE, or another interested party, permission to view their particular test series via Atlas from onshore. This provides a great deal of flexibility for the client, enables a supervisor to monitor multiple rigs for compliance from shore and removes the need for individuals to make the journey offshore.
A huge benefit of Atlas is that the client can review historical testing and get an accurate idea of how a specific rig is performing and efficiency between tests. We archive all the data for the client in the Cloud, on Microsoft servers – the most secure solution available. The customer can review data for the entire history they have been working with us – right back to the beginning. All the data is scaled, sorted and presented in an easily accessible format, categorized by operator or rig, etc. A company that is trying to analyze three or four rigs can easily work out if one rig is consistently working better than the others, and launch an investigation as to why that is.
Useful, Reliable Data At Your Fingertips
Atlas has been designed to be very intuitive. The Atlas system has a way of presenting a wide range of information that makes a lot of sense for the user, helping them determine where issues may be and allowing them to make the necessary improvements. The clients are presented with a familiar interface that integrates a lot of information into a concise format called ‘key points of information’ or KPIs. Trackable KPIs, such as ‘time on low pressure’ or ‘time on high pressure’ provide the user with interesting insights into how to improve operations. For example, being able to reduce time at high pressure has the potential to save equipment wear and tear and mitigate the amount of time someone is in the vicinity under high pressure. And of course, the less time on high pressure, the quicker they can back to work. The KPI data can be exported into an excel spreadsheet for review if required. If a client scrolls through and sees that a particular test is taking increasingly longer, they might want to investigate all the components involved in that test to determine if something needs to be rebuilt or changed out. If a client requests assistance with interpretation, we can help.
It is important to note that every single set of data that is viewable via Atlas has previously passed through a quality control and quality assurance process (QAQC). That means that the data is placed in Atlas, and OTC goes in and looks at that data and analyzes it on a test-by-test basis. Via this process, OTC can also offer hints and tips to the client on how they can make sure they are testing efficiently and using the software to their benefit.
Rig Operators Realizing Value
Whereas early testing with our clients will often highlight longer time between tests and issues with equipment, our clients experience a noted improvement over time once they start using the Atlas system. The OTC team sits down with the client to go over the results of the reports with them directly. Most of our long-term clients’ test series are incredibly efficient, and their equipment holds pressure. They simply don’t fail many tests, and that is just because they have become good at it. Using Atlas, they have been able to pay more attention than they used to. To sum up, OTC has changed the culture of testing on rigs. Firstly, our software is doing a better job of testing than the traditional circle charts, so now the rigs know their equipment is truly holding pressure. They are not just trying to get a flat line on a circle chart – they are trying to get a passing test with the software, and that mean their equipment will be holding pressure better than it did in the past. With these changes and the access to easy to interpret visual representations, the understanding of the value of maintenance improves across the rig, along with the satisfaction in improving the overall efficiency of the rig.

